Nevada Gaming Revenues and Collections(graph credit Nevada Gaming Control Board)
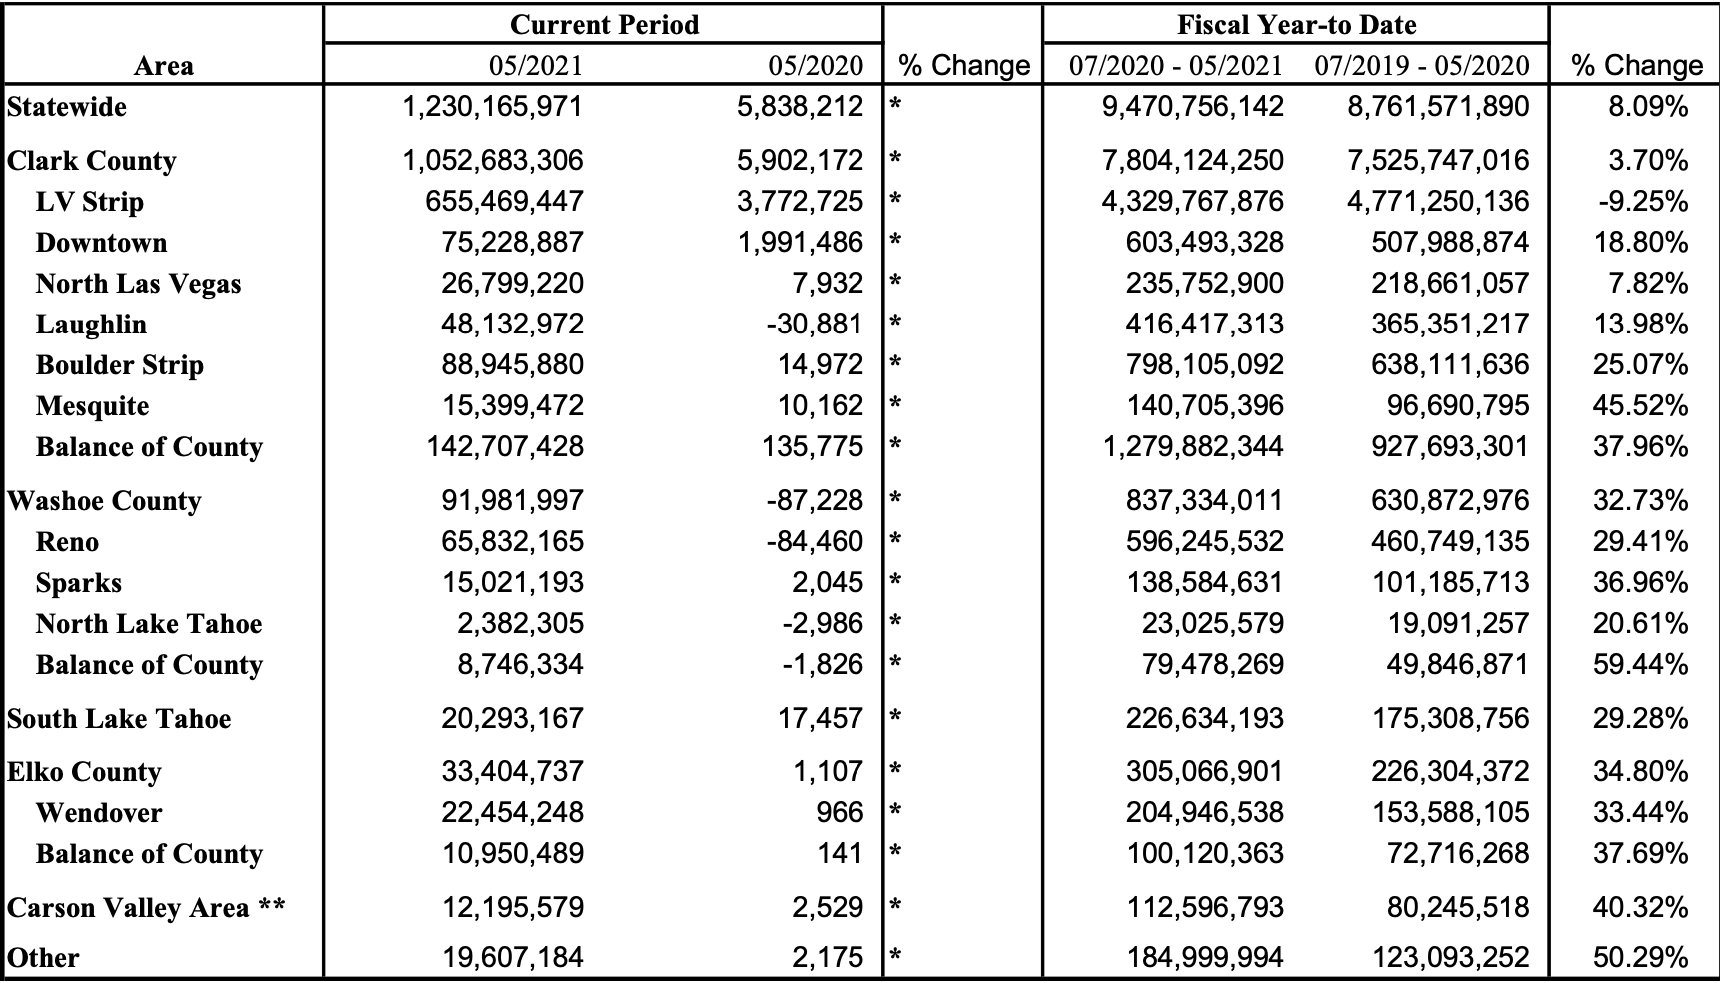
Comparing this year (July 2020-May 2021) to last year (July 2019-May 2020), in percentage of gambling, Mesquite (border with South Utah/Provo etc…) did the best than all towns in Nevada including Las Vegas and West Wendover (border with North Utah/Wasatch Front). Even in percentage of gambling West Wendover did poorly compare to Elko and the rest of the County.
So we can see that the gamblers from Salt Lake City area are still a little shy, but coming around. This is in percentage, but in numbers, West Wendover is doing okay(compare to the rest of the county).
In the whole State, May of last year was terrible in comparison to this year.
The whole state revenues for last year month of May was less than 6 Million dollars compare to this May of 2020 who is now 205 times (multiply that by more than 205 times than last year), at 1.23 billion. That’s also a 25% increase compared to May 2019 (pre-pandemic).
The Covid-19 pandemic got the Gambling industry spiraling downward into a recession, but this new record for Nevada is a sure sign that the state is recovering.
The Report says that Nevada’s nonrestricted gaming licensees reported a total “gaming win” of $1,230,165,971 for the month of May 2021. This amounts to a 20,970.94% increase compared to May 2020, when licensees reported a gaming win of $5,838,212. For the fiscal year (July 1, 2020 through May 31, 2021), gaming win has increased 8.09%. In the Percentage Fee Collections for the Month of June 2021, the State collected $107,028,883 in percentage fees during the month of June 2021*, based upon the taxable revenues generated in May 2021. Percentage fee collections improved by $232,770,693 compared to the prior year’s June, when percentage fee collections were -$125,741,810.
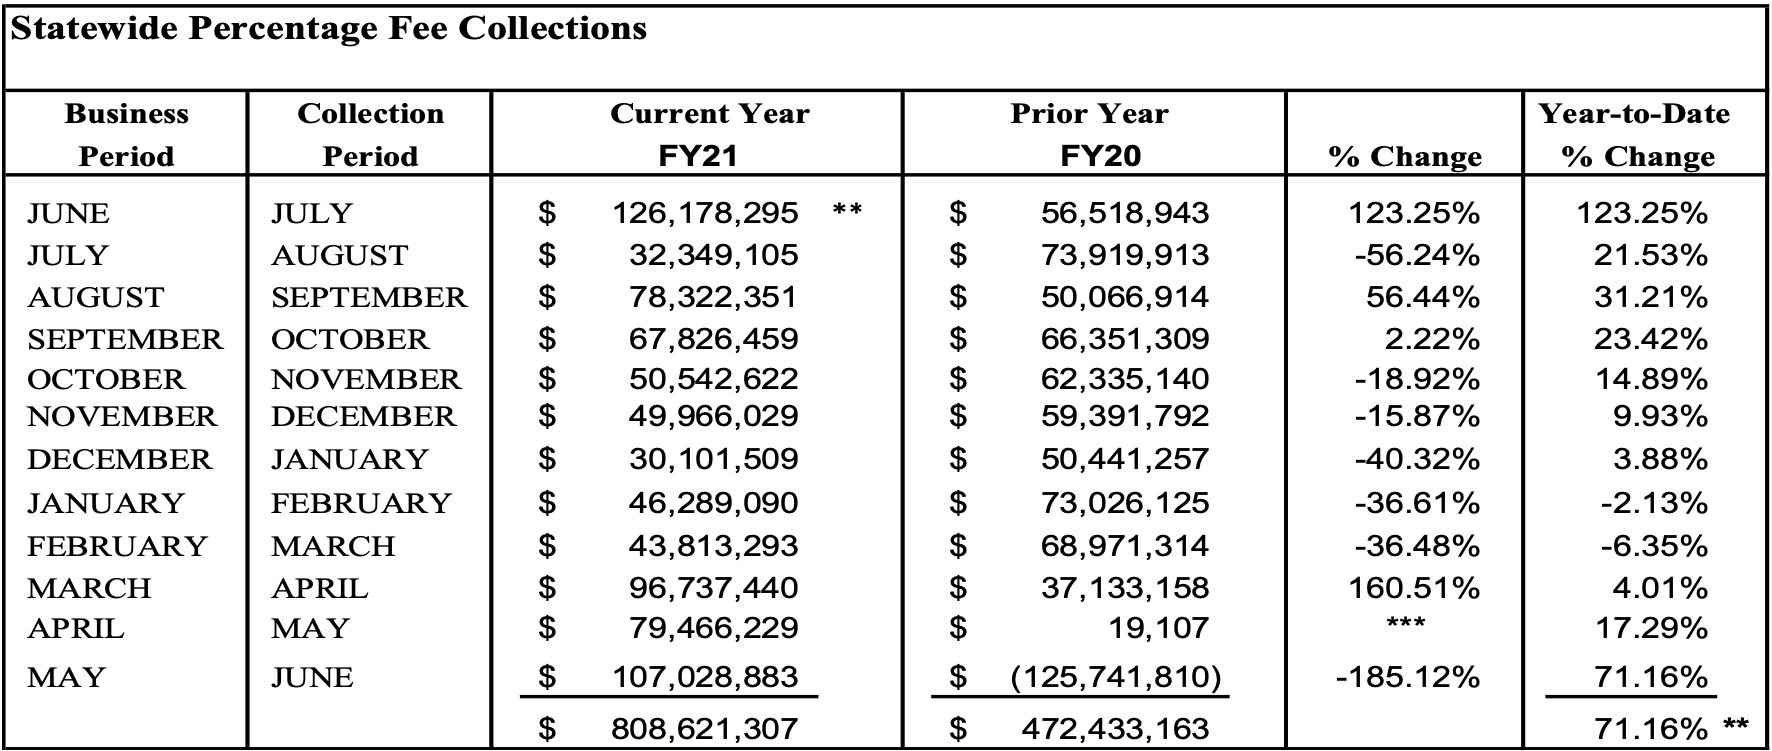
Senior Research Analyst Michael Lawton added that this amount includes $125,817,215 in unused tax credits pursuant to NRS 463.370(12) that were collected in FY20 and transferred at fiscal year-end. Additionally, the Year-to-Date percentage change reflects the transfer of these credits into FY21. But these amounts do not reflect the total amount of tax credits taken fiscal-year-to-date of $1,030,589. The collection totals include the most recent data available (and are subject to revision).